Cass Information Systems Reports First Quarter 2025 Results
Cass Information Systems, Inc. (Nasdaq: CASS), (the Company or Cass) reported first quarter 2025 earnings of $0.66 per diluted share, as compared to $0.52 in the first quarter of 2024 and $0.33 in the...


ST. LOUIS: Cass Information Systems, Inc. (Nasdaq: CASS), (the Company or Cass) reported first quarter 2025 earnings of $0.66 per diluted share, as compared to $0.52 in the first quarter of 2024 and $0.33 in the fourth quarter of 2024. Net income for the period was $9.0 million, an increase of 25.4% from $7.2 million in the same period in 2024 and an increase of $4.4 million, or 95.2%, as compared to the fourth quarter of 2024.
First Quarter Results
All comparisons refer to the first quarter of 2024, except as noted. On April 7, 2025, the Company signed an Asset Purchase Agreement providing for the sale of its Telecom Expense Management & Managed Mobility Services (“TEM”) business to Asignet USA Inc. The Company has applied discontinued operations accounting in accordance with FASB Accounting Standards Codification (“ASC”), Topic 205-20, “Presentation of Financial Statements – Discontinued Operations,” to the assets and liabilities being sold related to the Company's TEM Business Unit as of March 31, 2025 and December 31, 2024, and for the three-months ended March 31, 2025, December 31, 2024 and March 31, 2024, as applicable. All financial information in this earnings release is reported on a continuing operations basis, unless otherwise noted.
- Net income of $9.0 million, or $0.66 per diluted common share.
- Return on average equity and assets of 15.91% and 1.51%, respectively.
- Increase in net interest margin to 3.75% from 3.26%.
- Increase in net interest income of $2.8 million, or 17.0%.
- Announced signing of an Asset Purchase Agreement providing for the sale of the TEM business.
- Limited personnel expense growth to 1.4% despite AcuAudit acquisition and facility expense transaction volume increase.
- Maintained exceptional credit quality, with no non-performing loans or charge-offs.
- Received $2.0 million as partial consideration in a litigation settlement.
- Repurchased 116,109 shares of Company stock at weighted average price of $42.86.
Martin Resch, the Company’s President and Chief Executive Officer, noted, “Our quality financial results for the first quarter show progress toward our strategic plan and I am proud of the team’s execution. The positive results reflect our ongoing successful implementation of efficiency initiatives powered by technology, combined with an increase in our revenue driven by net interest income.” Resch added, “The combination of continued efficiencies via technology, improvement in our net interest margin and the closure of pipeline opportunities in our Transportation and Facility lines of business should result in meaningful profitability improvement over recent quarters. In addition, the successful sale of our TEM business will enable us to concentrate on our strengths in financial exchange and information processing.”
First Quarter 2025 Highlights
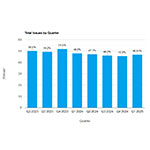
Transportation Invoice and Dollar Volumes – Transportation invoice volumes of 8.36 million declined 4.7% as compared to the first quarter of 2024 and 6.3% as compared to the fourth quarter of 2024. The decline in invoice volumes is reflective of an overall decline in shipments as well as severe weather in January 2025. Transportation dollar volumes were $8.6 billion during the first quarter of 2025, decreases of 3.3% as compared to the first quarter of 2024 and 3.9% as compared to the fourth quarter of 2024. The decline in dollar volumes was primarily due to the decline in invoice volume, partially offset by a slight increase in average dollars per invoice.
Facility Expense Invoice and Dollar Volumes – Facility expense invoice volumes of 4.2 million increased 2.7%. as compared to the first quarter of 2024 and 3.4% as compared to the fourth quarter of 2024. Facility expense dollar volumes totaled $5.8 billion during the first quarter of 2025, increases of 16.1% as compared to the first quarter of 2024 and 15.7% as compared to the fourth quarter of 2024. The increases are largely reflective of new client volume.
Processing Fees – Processing fees decreased $390,000, or 2.3%, over the same period in the prior year. The decrease in processing fees was largely driven by the decrease in transportation invoice volumes of 4.7%, partially offset by the increase in facility expense invoice volumes of 2.7%.
Financial Fees – Financial fees, earned on a transactional level basis for invoice payment services when making customer payments, decreased $637,000, or 6.0%. The decrease in financial fees was primarily due to a decline in transportation dollar volumes of 3.3% and related decline in average payments in advance of funding of 10.7%.
Net Interest Income – Net interest income increased $2.8 million, or 17.0%. The increase in net interest income was attributable to the net interest margin improving to 3.75% as compared to 3.26% in the same period last year, in addition to an increase in average interest-earning assets of $41.4 million, or 2.0%.
The Company’s net interest margin improvement was driven by increases in the average yield on loans and investment securities of 55 and 15 basis points, respectively, combined with a decline in the average cost of total deposits of 31 basis points. The increase in loan yield was driven by loan growth at current market interest rates and continued maturing and re-pricing of existing fixed rate loans to current market interest rates. The decline in the cost of total deposits was driven by the reduction in short-term interest rates in the last four months of 2024. The Company generally benefits from a higher interest rate environment due to a large percentage of its funding sources being non-interest bearing.
Provision for Credit Losses - The Company recorded a provision of credit losses of $905,000 during the first quarter of 2025 as compared to $95,000 in the first quarter of 2024. The provision for credit losses for the first quarter of 2025 was largely driven by the increase in total loans of $59.9 million, or 5.5%, as compared to December 31, 2024.
Personnel Expenses - Personnel expenses increased $372,000, or 1.4%. Salaries and commissions increased 0.9%, as a result of merit increases and the December 2024 acquisition of AcuAudit, partially offset by a decrease in average full-time equivalent employees (“FTEs”) of 3.4% due to strategic investments in various technology initiatives. Net periodic pension cost was $0 for the first quarter of 2025 as compared to $195,000 in the first quarter of 2024 and $3.6 million in the fourth quarter of 2024 due to the termination of the Company’s noncontributory defined-benefit pension plan in the fourth quarter of 2024. Other benefits increased $327,000, or 7.2%, due to higher health insurance costs, partially offset by the decline in average FTEs.
Equipment Expense - Equipment expense increased $463,000 primarily due to an increase in depreciation expense on software related to recently completed technology initiatives.
Bad Debt Recovery - The Company recorded a bad debt recovery of $2.0 million related to partial consideration received in a litigation settlement.
Loans - When compared to December 31, 2024, ending loans increased $59.9 million, or 5.5%. The Company experienced growth in its commercial and industrial and faith-based loan portfolios during the first quarter of 2025.
Payments in Advance of Funding - Average payments in advance of funding decreased $20.7 million, or 10.7%, primarily due to a 3.3% decrease in transportation dollar volumes, which led to fewer dollars advanced to freight carriers, in addition to the continued consolidation of freight carriers.
Deposits – Average deposits decreased $46.1 million, or 4.3%, when compared to the first quarter of 2024. The Company has experienced deposit attrition due to a decrease in the overall level of some larger commercial deposits due to client funding needs for acquisitions and other purposes.
Accounts and Drafts Payable - Average accounts and drafts payable increased $57.9 million, or 5.7%. The increase in these balances, which are non-interest bearing, are primarily reflective of the increase in facility dollar volumes of 16.1%. Accounts and drafts payable are a significant source of funding generated by payment float from transportation and facility clients.
Shareholders’ Equity - Total shareholders’ equity increased $5.2 million since December 31, 2024 as a result of net income of $9.0 million and a decrease in accumulated other comprehensive loss of $5.7 million primarily related to the fair value of available-for-sale investment securities, partially offset by the repurchase of Company stock of $5.0 million and dividends of $4.2 million.
About Cass Information Systems
Cass Information Systems, Inc. is a leading provider of integrated information and payment management solutions. Cass enables enterprises to achieve visibility, control and efficiency in their supply chains, communications networks, facilities and other operations. Disbursing over $90 billion annually on behalf of clients, and with total assets of $2.3 billion, Cass is uniquely supported by Cass Commercial Bank. Founded in 1906 and a wholly owned subsidiary, Cass Commercial Bank provides sophisticated financial exchange services to the parent organization and its clients. Cass is part of the Russell 2000®. More information is available at www.cassinfo.com.
Forward Looking Information
This information contains forward-looking statements within the meaning of the Private Securities Litigation Reform Act of 1995. Such statements include future financial and operating results, expectations, intentions, and other statements that are not historical facts. Such statements are based on current beliefs and expectations of the Company’s management and are subject to significant risks and uncertainties. These risks and uncertainties include the impact of economic and market conditions, inflationary pressures, risks of credit deterioration, interest rate changes, governmental actions, market volatility, security breaches and technology interruptions, energy prices and competitive factors, among others, as set forth in the Company’s most recent Annual Report on Form 10-K and subsequent reports filed with the Securities and Exchange Commission. Actual results may differ materially from those set forth in the forward-looking statements.
Note to Investors
The Company has used, and intends to continue using, the Investors portion of its website to disclose material non-public information and to comply with its disclosure obligations under Regulation FD. Accordingly, investors are encouraged to monitor Cass’s website in addition to following press releases, SEC filings, and public conference calls and webcasts.
Consolidated Statements of Income (unaudited) | |||||||||||
($ and numbers in thousands, except per share data) | |||||||||||
| Quarter |
| Quarter |
| Quarter | ||||||
Processing fees | $ | 16,469 |
|
| $ | 15,680 |
|
| $ | 16,859 |
|
Financial fees |
| 9,961 |
|
|
| 10,509 |
|
|
| 10,598 |
|
Total fee revenue | $ | 26,430 |
|
| $ | 26,189 |
|
| $ | 27,457 |
|
|
|
|
|
|
| ||||||
Interest and fees on loans |
| 15,350 |
|
|
| 14,428 |
|
|
| 12,776 |
|
Interest and dividends on securities |
| 4,147 |
|
|
| 4,104 |
|
|
| 4,437 |
|
Interest on short-term investments |
| 3,893 |
|
|
| 3,844 |
|
|
| 4,441 |
|
Total interest income | $ | 23,390 |
|
| $ | 22,376 |
|
| $ | 21,654 |
|
Interest expense |
| 4,116 |
|
|
| 4,612 |
|
|
| 5,178 |
|
Net interest income | $ | 19,274 |
|
| $ | 17,764 |
|
| $ | 16,476 |
|
Provision for credit losses |
| (905 | ) |
|
| (93 | ) |
|
| (95 | ) |
Loss on sale of investment securities |
| (18 | ) |
|
| (33 | ) |
|
| -- |
|
Other |
| 1,626 |
|
|
| 1,757 |
|
|
| 1,267 |
|
Total revenues | $ | 46,407 |
|
| $ | 45,584 |
|
| $ | 45,105 |
|
Salaries and commissions |
| 21,165 |
|
|
| 21,400 |
|
|
| 20,971 |
|
Share-based compensation |
| 1,241 |
|
|
| 545 |
|
|
| 1,195 |
|
Net periodic pension cost |
| — |
|
|
| 3,588 |
|
|
| 195 |
|
Other benefits |
| 4,873 |
|
|
| 4,128 |
|
|
| 4,546 |
|
Total personnel expenses | $ | 27,279 |
|
| $ | 29,661 |
|
| $ | 26,907 |
|
Occupancy |
| 721 |
|
|
| 679 |
|
|
| 676 |
|
Equipment |
| 2,294 |
|
|
| 2,275 |
|
|
| 1,831 |
|
Amortization of intangible assets |
| 293 |
|
|
| 174 |
|
|
| 173 |
|
Bad debt (recovery) expense |
| (2,000 | ) |
|
| -- |
|
|
| -- |
|
Other |
| 6,943 |
|
|
| 7,575 |
|
|
| 6,621 |
|
Total operating expenses | $ | 35,530 |
|
| $ | 40,364 |
|
| $ | 36,208 |
|
Income from continuing operations, before income tax expense | $ | 10,877 |
|
| $ | 5,220 |
|
| $ | 8,897 |
|
Income tax expense |
| 2,326 |
|
|
| 1,060 |
|
|
| 1,833 |
|
Net income from continuing operations | $ | 8,551 |
|
| $ | 4,160 |
|
| $ | 7,064 |
|
Income from discontinued operations, net of tax |
| 415 |
|
|
| 434 |
|
|
| 88 |
|
Net income | $ | 8,966 |
|
| $ | 4,594 |
|
| $ | 7,152 |
|
|
|
|
|
|
| ||||||
If you liked this article and want to stay up to date with news from InnovationOpenLab.com subscribe to ours Free newsletter. Related news
Last NewsRSA at Cybertech Europe 2024Alaa Abdul Nabi, Vice President, Sales International at RSA presents the innovations the vendor brings to Cybertech as part of a passwordless vision for… Italian Security Awards 2024: G11 Media honours the best of Italian cybersecurityG11 Media's SecurityOpenLab magazine rewards excellence in cybersecurity: the best vendors based on user votes How Austria is making its AI ecosystem growAlways keeping an European perspective, Austria has developed a thriving AI ecosystem that now can attract talents and companies from other countries Sparkle and Telsy test Quantum Key Distribution in practiceSuccessfully completing a Proof of Concept implementation in Athens, the two Italian companies prove that QKD can be easily implemented also in pre-existing… Most readIntegral AI Unveils World’s First AGI-capable Model#AGI--Integral AI, a global leader in the development of embodied AGI, today announced the successful testing of the world’s first AGI-capable model.… Reply Achieves the AWS Agentic AI Specialization and Is Named an Implementation…Reply [EXM, STAR: REY] announced that it has achieved the Amazon Web Services (AWS) Agentic AI Specialization, a new category within the AWS AI Competency.… Tecnotree Emerges as CX Catalyst Winner for Impact at The Fast Mode Awards…Tecnotree, a global digital platform and services leader for AI, 5G, and cloud-native technologies, has won the CX Catalyst award for Impact at The Fast… CoMotion GLOBAL 2025 Launches in Riyadh: Global Mobility Leaders Unite…Riyadh is rapidly becoming one of the world's most ambitious urban mobility laboratories, where next-generation technologies move from blueprint to real-world… G11 Media Networks
InnovationOpenLab is a channel of BitCity, a newspaper registered at the court of Como , 
| |||||||||||